Tarun Pokiya, Lead Agronomist, Prasanna Kumar, Senior Software Engineer, Hannah Timmis, India Research Manager, Tushar Singh, Research and Operations Associate, Srinivas VT, Senior Associate, and Revati Vaidya, Process and Product Innovation Associate, collaborated on this blog post to illustrate how a synthesis of workstreams – across agronomy, technology, research, and operations teams – inform our Ama Krushi Kharif digital advisory campaign.
From the foothills of the Himalayas in the west to Vietnam in the east, hundreds of millions of farmers’ eyes turn each June to the sky in anticipation of the monsoon. The coming of the rains marks the commencement of the Kharif planting cycle, the region’s primary growing season.
The quality of the monsoon season impacts the livelihoods of hundreds of millions of farming households, and – by extension – the caloric intake of billions of people. Kharif is disproportionately important for poor, smallholder farmers – the primary users of PxD’s services. Kharif is the season for growing rice – a critical staple and subsistence crop – and the rains benefit the land indiscriminately, whether you have resources to fund irrigation equipment and infrastructure, or not. But relying on the heavens to provide is risky: the monsoon is notoriously fickle, and unpredictable – the rains may come early, or late and progress consistently or haphazardly; climate change is shifting weather patterns and escalating the frequency and intensity of extreme weather events; and, as ever, pests and diseases lurk with unpredictable triggers.
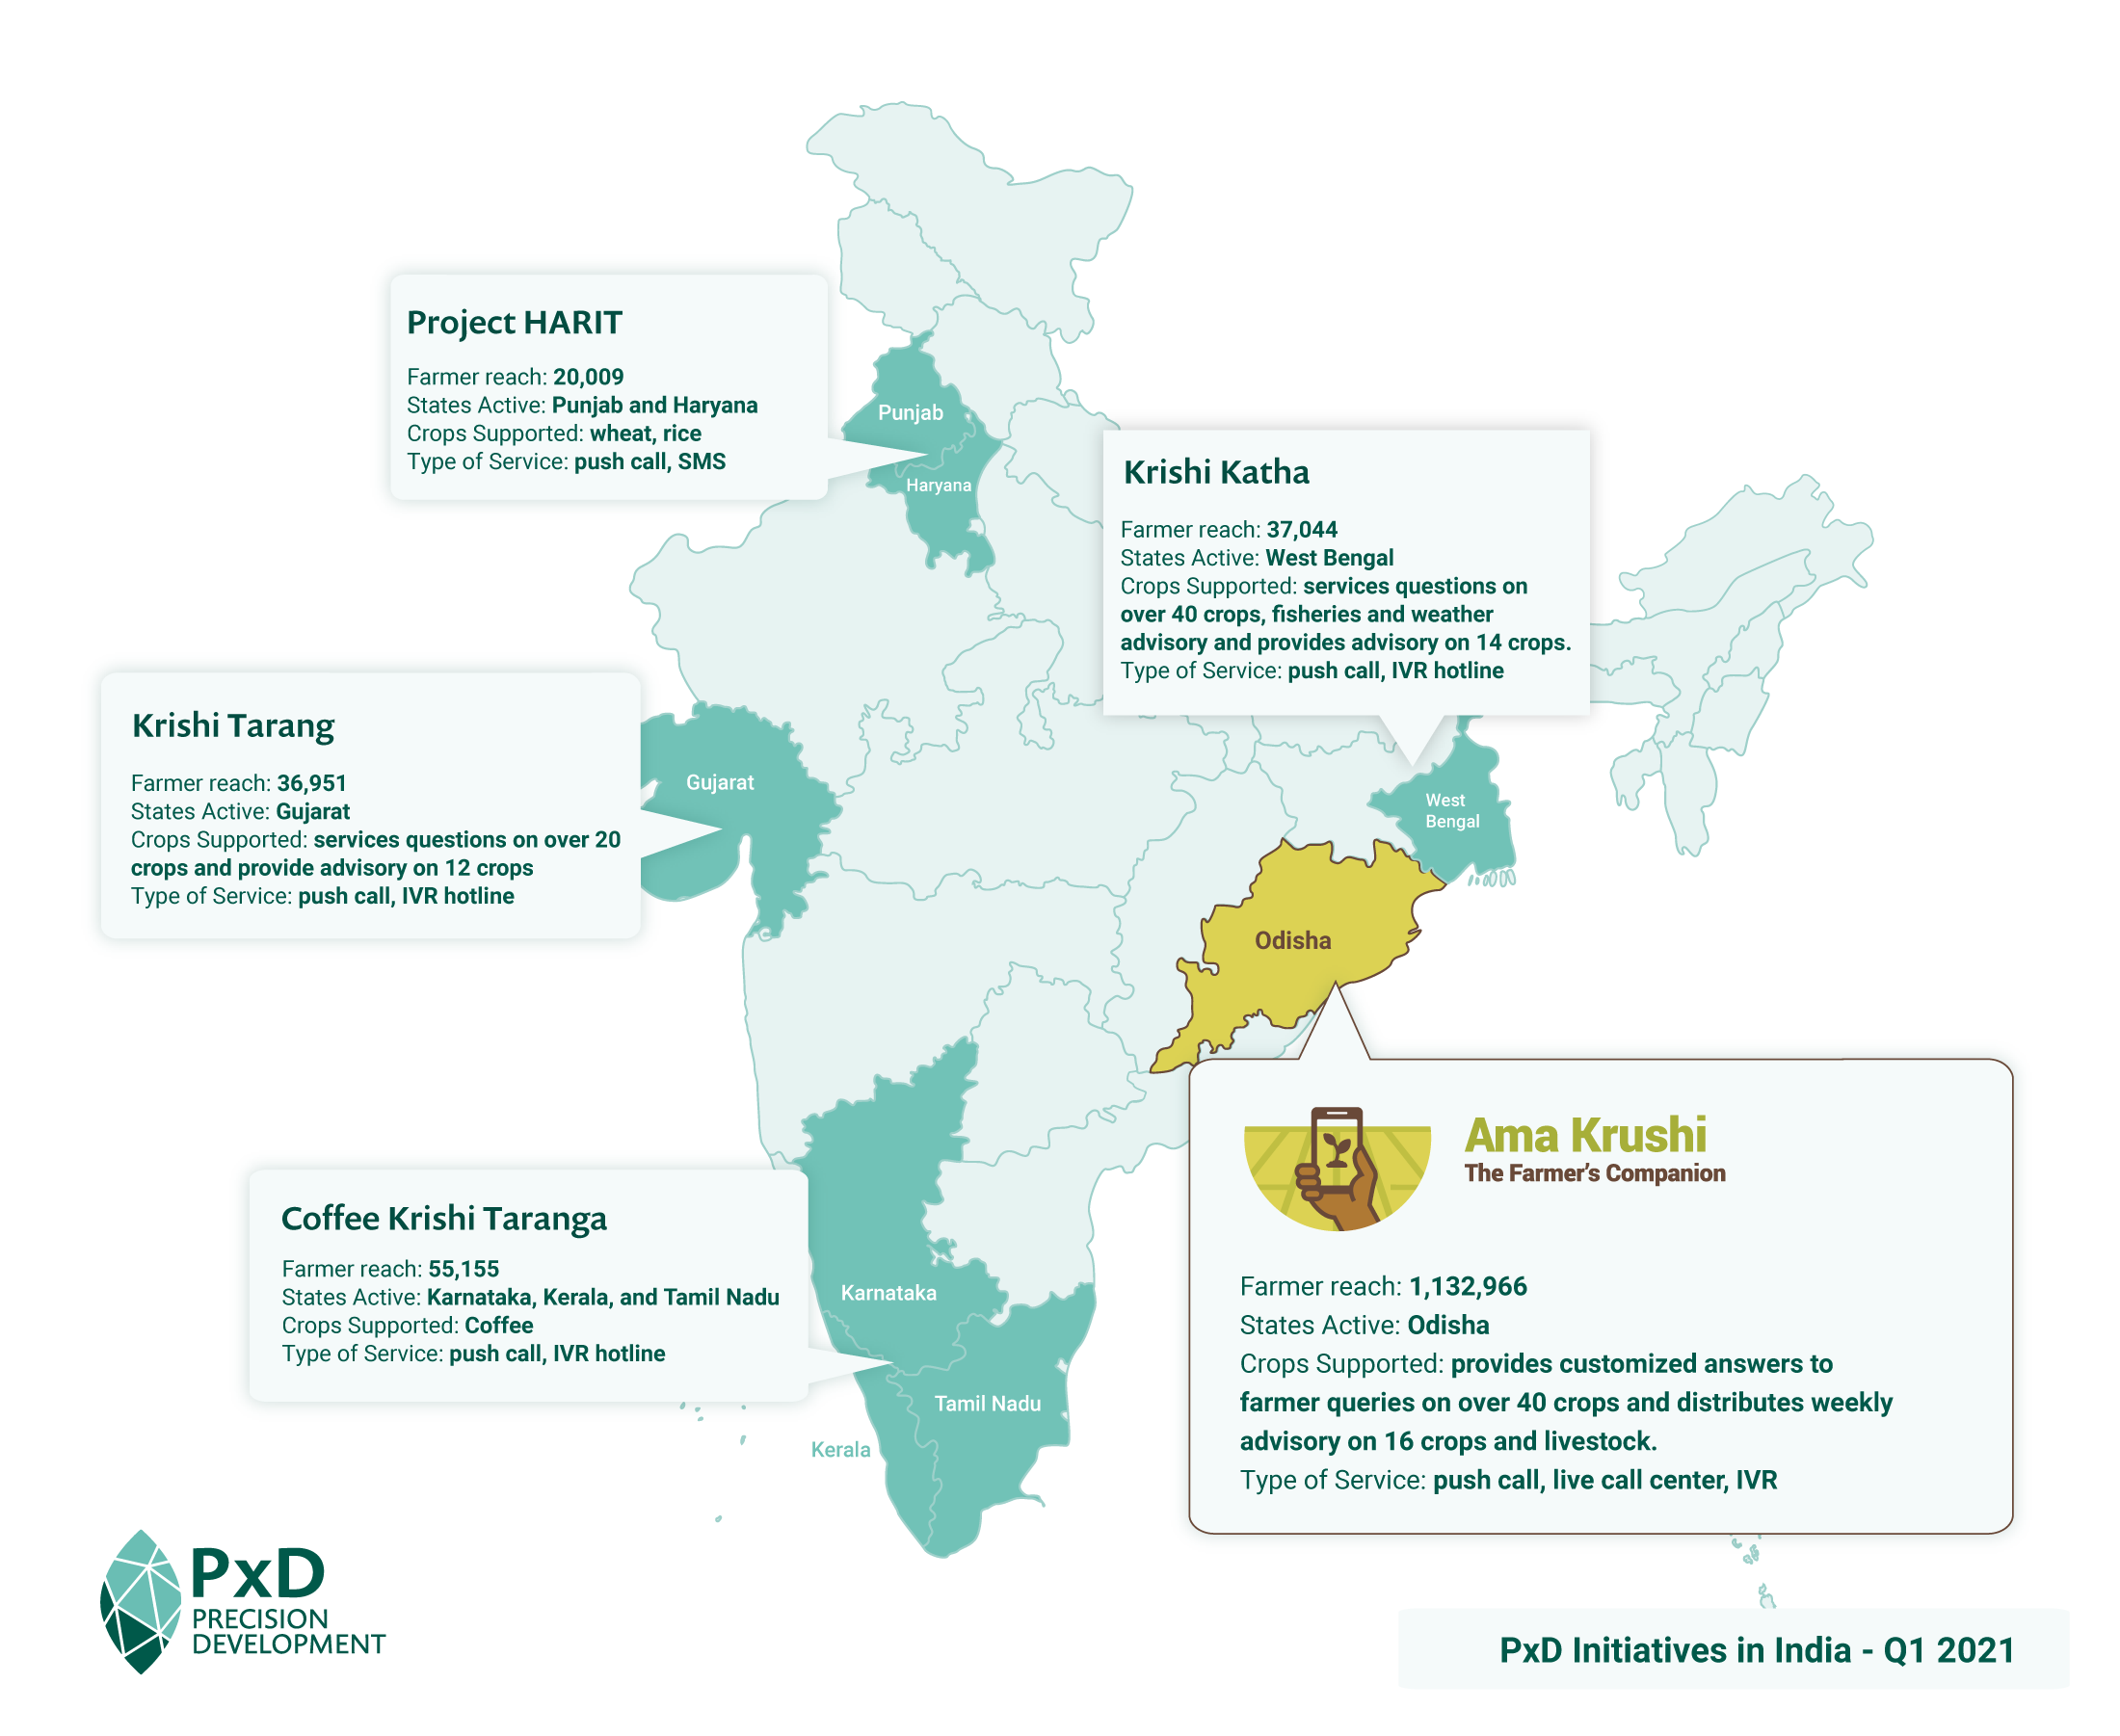
Overview of PxD Initiatives in India – Q1 2021
Agronomy
At PxD, the core of our work is to provide actionable information to people who need it, when they need it. All of our current services in India provide agricultural information to farmers timed to the crop cycle. Agricultural productivity can be significantly impacted by the timing and quality of critical decisions. As a consequence, the timing of information delivery is critical and is intended to maximize its value for farmers as they make key decisions and initiate activities in their fields.
In a typical year, South Asia’s monsoon season commences in the third or fourth week of June. At PxD, our teams in India have been hard at work preparing for the onset of the rains. In the second week of June, we commenced sending advisory information to over 1.4 million farmers, 1.3 of whom are served by our Ama Krushi service in Odisha. We will provide farmers with information on nineteen different crops.
In the monsoon-drenched east of the country, “paddy” (what people in the region call rice) is king, both in terms of the number of farmers who plant it and as a critical source of nourishment. In Odisha, 97 percent of farmers on the Ama Krushi service, plant rice during the Kharif season.
In the first weeks of June, our agronomy teams prepare paddy pre-planting and seed selection advisory to be sent to farmers ahead of the first rains. This information is intended to help farmers make more informed decisions and actions about purchasing inputs, the preparation of soils, and planning planting schedules. Pre-planting advisory is followed by advice on optimal planting practices, nursery management, fertilizer management, and pests and disease management.

As the Kharif growing season begins to wane in November, the team will commence pushing advice to farmers about when and how to harvesting non-paddy crops, and other post-harvest topics, such as best practices for storage and information about market prices. Rice stays in the field longer than most Kharif crops; in a typical year, the Odisha paddy harvest commences in December and can last well into January.
Tarun Pokiya, PxD India’s Lead Agronomist, explains the day-to-day work of the agronomy team and its importance:
At the peak of the Kharif season, our Ama Krushi team may broadcast up to 24 different messages in a week, depending on customization permutations. Kharif is by far and away the most important growing season for our farmers. While all farmers grow Kharif crops, only about 60 percent of Odishan farmers grow crops during Rabi, the sub-continent’s winter growing season. This is in part because most Rabi crops are irrigation-dependent, and many poor farmers have no access to irrigation infrastructure and equipment. The weather is also far more predictable. In the Rabi cropping cycle, the weather varies only a little year on year. By contrast, cyclones and other extreme events can wreak havoc on Kharif farmers, and the onset of the rains varies wildly by year and location. Kharif is a much more technical and complex planting season, and our farmers stand to gain much more from well-timed information, customized to their location and conditions.
Customization
A key advantage of digital extension is the ability to customize content to make it more relevant to individual farmer’s conditions, choices, and needs.
In Odisha, farmer users of the Ama Krushi service receive information customized according to the following dimensions:
- Location (by district) – the onset of monsoon can be very different in the west compared to the coastal belt, and crop calendars are customized accordingly; customization is also calibrated according to current weather conditions throughout the growing season.
- Dialect preference – Sambalpuri and Oriya
- Crops planted – paddy, blackgram, greengram, cotton, bitter gourd, bottle gourd, cabbage, cauliflower, groundnut, maize, pointed gourd, redgram, ridge gourd, brinjal, tomato, okra, and sugarcane.
- Paddy farmers receive further customization based on the type of land they work – low, medium or upland – which significantly impacts seed choice and growing conditions
- Irrigation status – has irrigation/does not have
Content preparation and process
PxD’s team of eight agronomists, one livelihood expert, and one fisheries expert, engages in systematic preparation ahead of each planting season. Given Kharif’s disproportionate importance, and the complexity of interwoven and potentially countervailing factors, the teams commence planning months in advance of the first message being sent to farmers.
- Our agronomists initially engage in an overall season scoping activity: prioritizing crops, laying out provisional timing for advisory content based on crop cycles, etc.
- Following the initial process, the teams prepare formal crop calendars for each crop supported. They layout parameters for the commencement and conclusion of cropping cycles, identify and prioritize topics and critical behaviors for promotion, etc.
- Thereafter agronomists are assigned crops and topics and begin drafting advisory content focussing on a package of practices for each crop.
- The team then assigns weekly advisory topics for drafting – agronomists prepare draft scripts in English based on the crop calendar and plan.
- The draft advisory is then submitted to a content review committee (local experts and officials) for approval.
- Following approval of the script in English, it is translated into the local dialect.
- Priority messages are field-tested to improve relevance and impact (see the section below)
- Voice messages are then recorded. A senior agronomist will then check the recording to ensure that the quality of the audio and translation is sufficient for broadcast.
- Messages are checked one last time by the Content team lead before they are uploaded to the system for broadcast.
Steps 4 through 8 are conducted on a rolling basis, whereby the content for the second week of June is prepared in the first week of June; for the third week in the second etc. This allows us to adjust the cycle of content as the weather shifts, and accommodate urgent advisory messages, for example in response to extreme weather events, or pest infestations.
Our teams are in constant communication via WhatsApp and a rotation of organizational meetings. We have to keep a constant eye on the weather and other conditions.
Cyclone advisory to farmers in Odisha ahead of Cyclone Amphan (May 2020)
Namaskar. Welcome to Ama Krushi, the free Agriculture Information Service of the Department of Agriculture, Government of Odisha. Some specific information for the farmer: Most of Odisha is likely to receive light to moderate rainfall over the next 24 hours due to the cyclone system and the resulting low pressure in the southeast of the Bay of Bengal and along the Andaman coast. This system is likely to gradually condense and take the form of cyclone. As a result, coastal districts are likely to receive moderate to heavy rains and strong winds. Following the rain, remove all excess water from your fields: paddy [rice], sesamum, jute, brinjal, chili, okra, gourds, and flowering crops. Cut paddy seedlings that are ready to be harvested and store them in a safe place. In your vegetable fields following the rain, stop any irrigation and refrain from applying insecticides. If mango, banana, and papaya are ripe, harvest them before the wind blows them from your trees. If cashew nuts ready for harvesting, pick the nuts and let them dry. Put in storage sufficient dry food and water for your livestock. Please contact Ama Krushi’s free hotline 155 333 for more information. Thank You.
Prasanna Kumar, PxD’s Senior Software Engineer, explains how we program calls and push calls through Paddy, our in-house technology stack (not the crop!).
Our tech platform – Paddy – incorporates a high degree of automation and can run on a variety of backends, such as SMS platforms, IVR platforms, or chatbots on WhatsApp or Telegram. Our Ama Krushi, kharif platform is a Push Call platform.
Scheduling push calls can be complex in a project of the scale of Ama Krushi. As detailed above, our agronomist team sends out crop-specific, season-specific, and livestock-specific messages to farmers. To maximize their relevance to farmers’ needs, messages must take into consideration a farmers’ geography (district), topology (high land, low-lying land), the availability of irrigation, and – in some cases – the gender of the farmer receiving information.
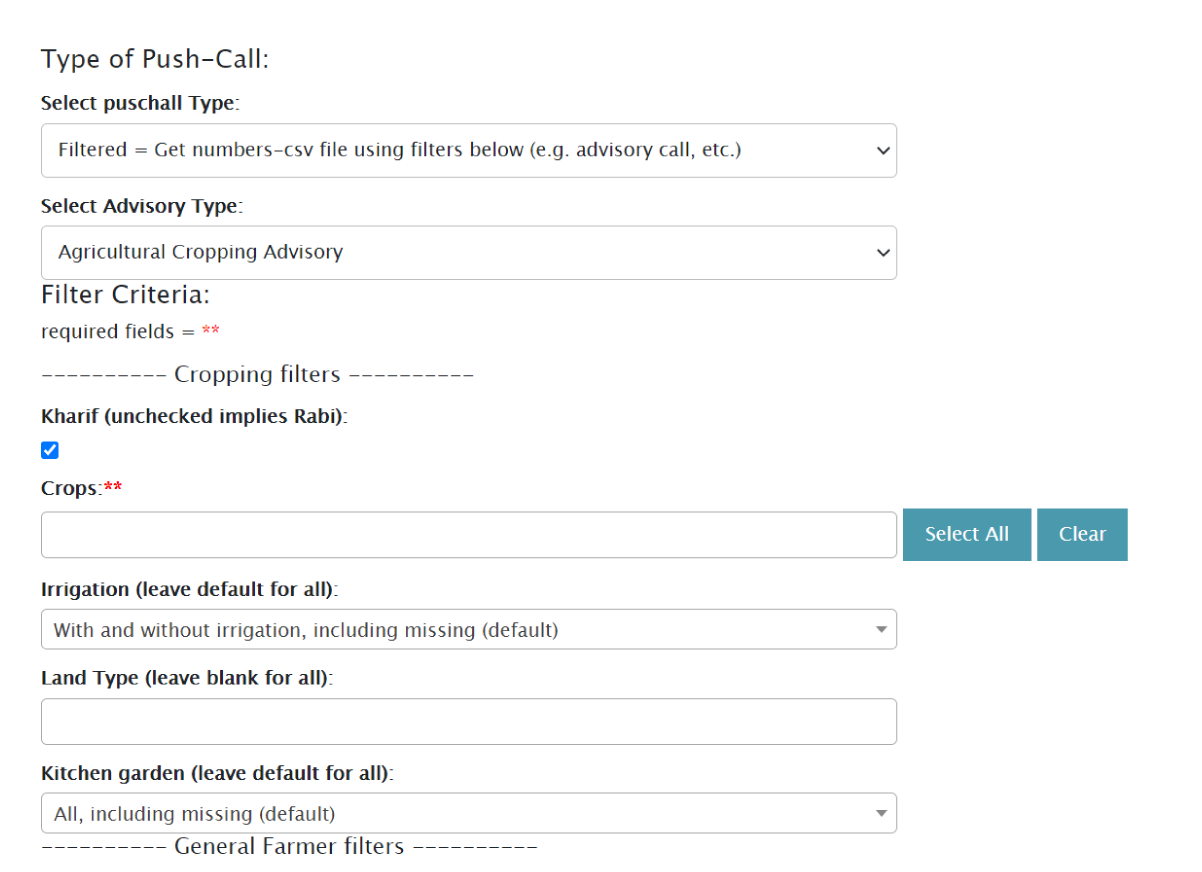
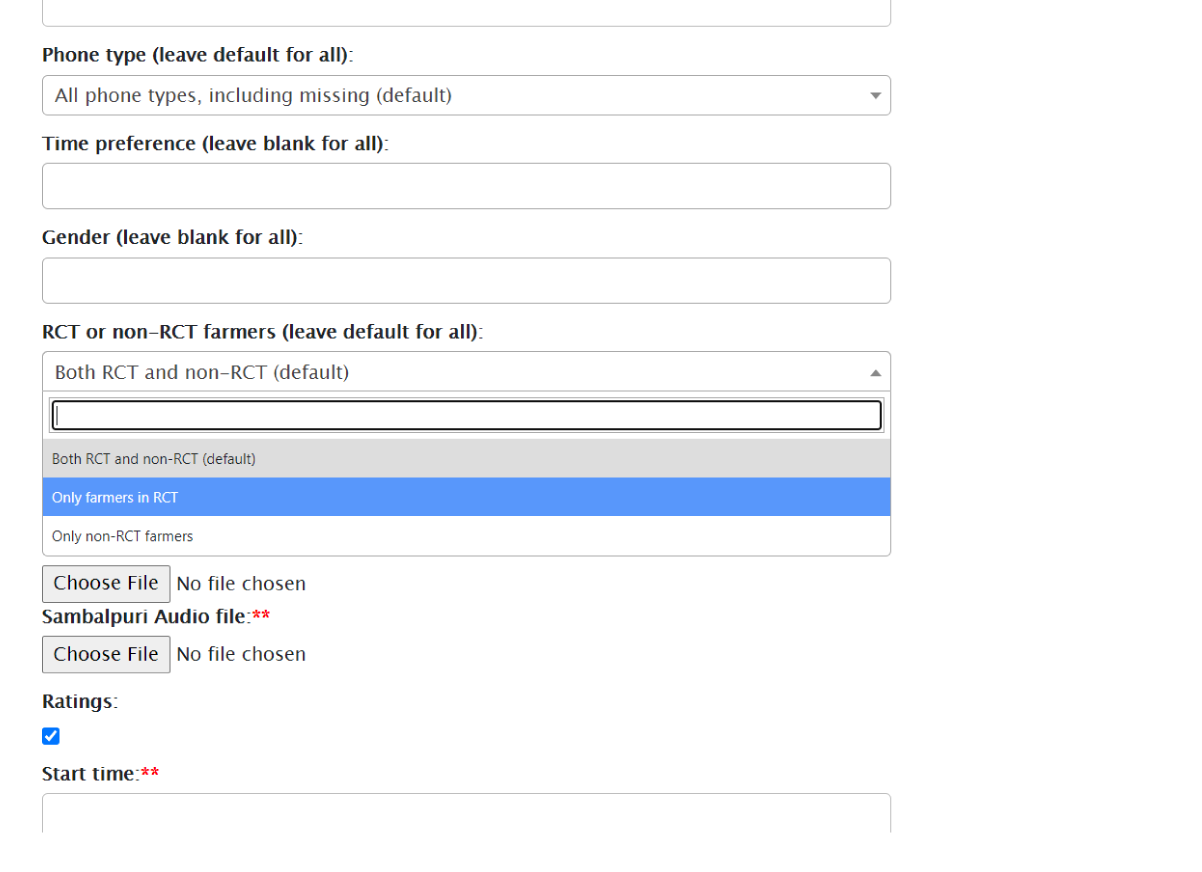
To make the job easier for agronomists, we provide a Graphical User Interface (GUI) to schedule push calls. The GUI allows agronomists to apply filtering criteria (such as crops, season, irrigation, gender, district, etc.) which are then applied to each message. The message is then programmed to correspond to all the corresponding profiles in the database and returns only those profiles that satisfy all the filters.
Our Graphical User Interface is designed to make it easy for our agronomists to apply filters and program calls
The agronomist then uploads the message audio to be sent. Our platform supports sending messages in different languages to farmers based on their stated language preferences. Hence, audio files for all supported languages have to be uploaded. Paddy (our backend system) then automatically assigns the language preference for a farmer from his profile and schedules the correct audio. The agronomist then picks the date and time at which the scheduled messages will start getting pushed. This completes the scheduling process.
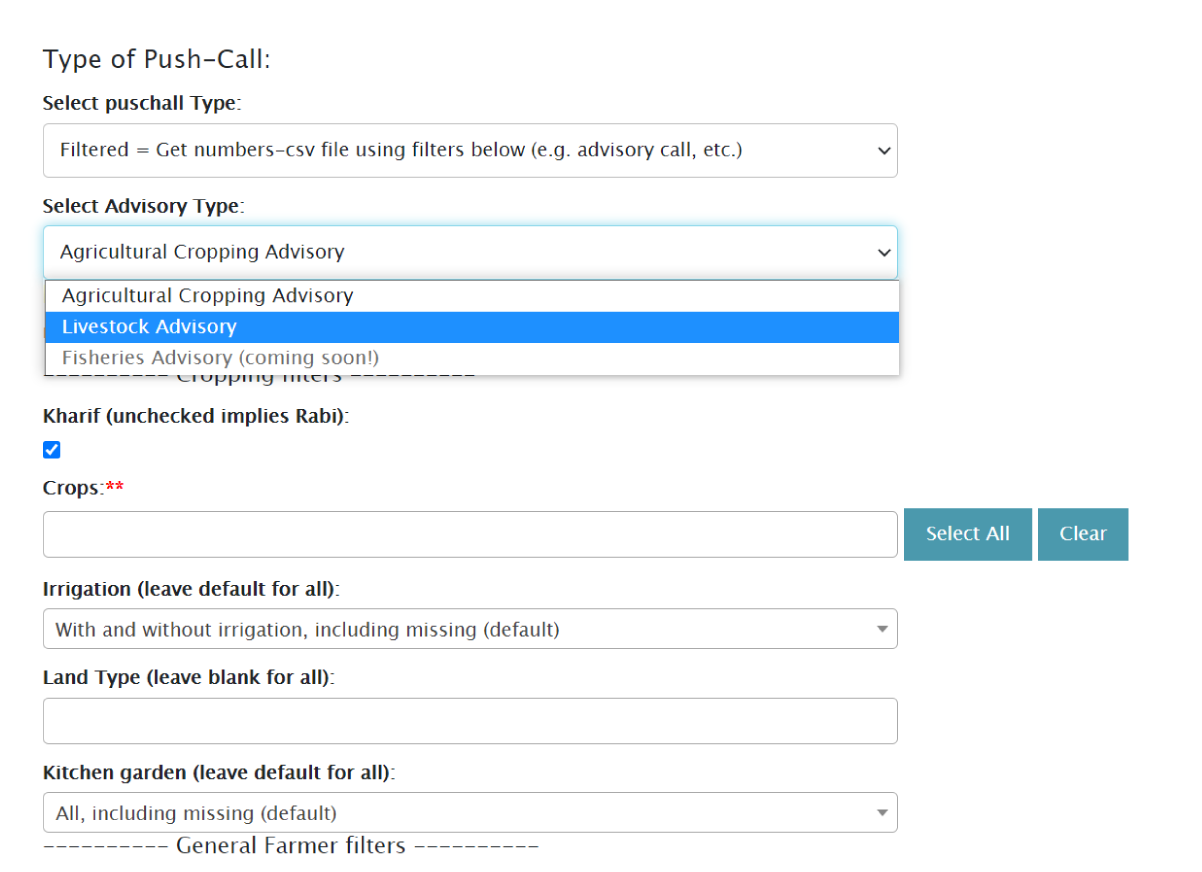
Our Ama Krushi push call service sends advisory on multiple topics, including cropping cycles, and livestock husbandry. We will be incorporating fisheries advisory shortly.
Our scheduling interface also allows for special cases. Here I will mention two:
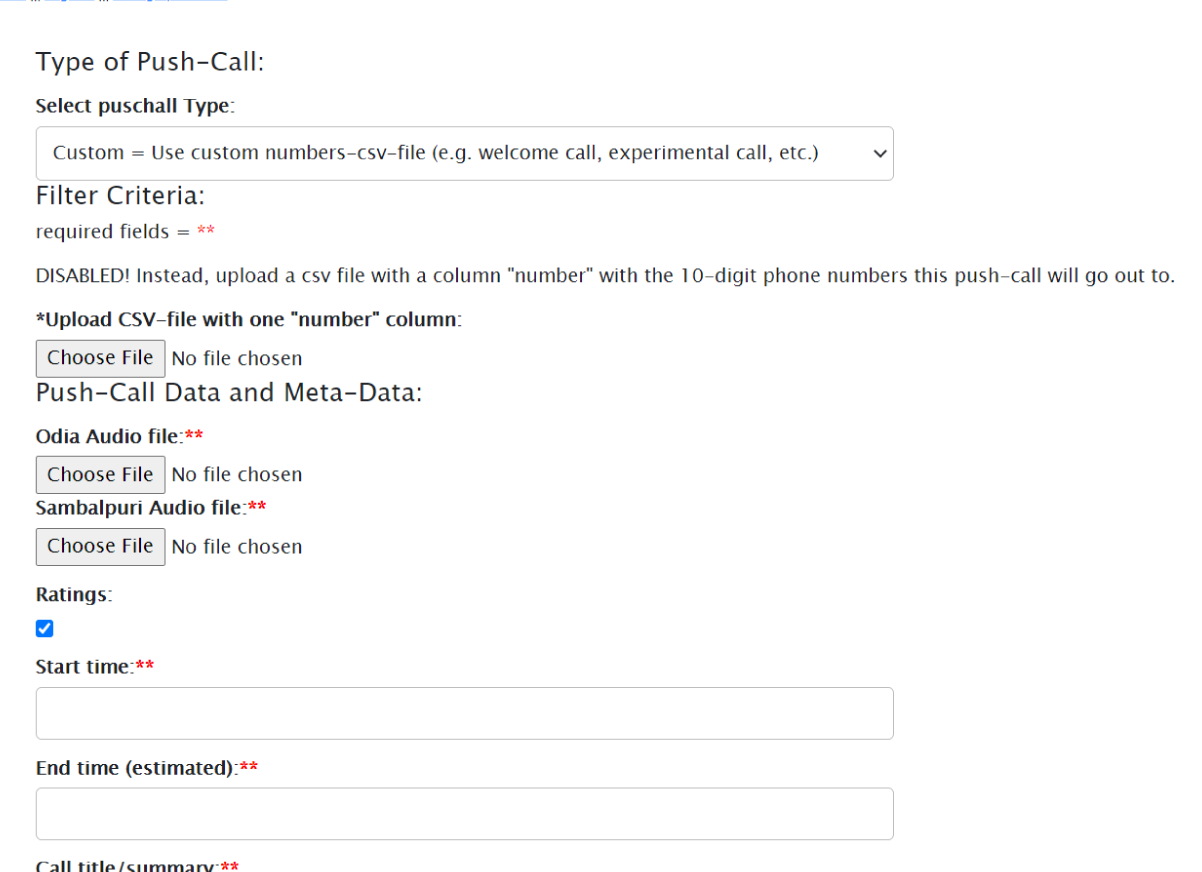
Firstly, we need to schedule calls for farmers who may not have been fully profiled yet and for whom we have insufficient information in the database. The system allows for the uploading of phone numbers in comma-separated values (csv) format and then schedules messages to all the numbers in the list. Since these numbers are potentially un-profiled, no filters can be applied to them and a default language is assumed for all farmers (Odia in the case of Ama Krushi).
Paddy is designed to support and facilitate our research work. A/B testing. RCTs and other research experimentation can be facilitated, and filtered within the platform.
Secondly, to support A/B testing we provide a filter that ensures that farmers who are marked as “Control” or “Test” farmers do not receive the calls. Under special circumstances we allow this to be over-ridden and the same message will then be sent to all farmers (for example if we are warning farmers about an impending natural disaster, or COVID-related messages).
Hannah Timmis, PxD’s India Research Manager, and Tushar Singh, Research and Operations Associate, explain how we use field testing to drive product development, innovation and improved service delivery:
From resource constraints to limited access to capital and agricultural inputs, small-scale farmers in Odisha confront uniquely challenging barriers that limit their ability to close the yield gap. In this context, the objective of providing locally relevant and actionable information, customized to a farmer’s specific needs, is by no means simple.
To promote efficiency and the relevance of our content, we are piloting a two-step process for content design. This process aims to identify a long list of recommendations with the potential for high impacts on productivity and yields and frame these recommendations as messages that can be easily understood and acted on when they are communicated to farmers.
Step 1: Improve Content Prioritisation & Scheduling
Initially, while designing advisory content for the season, we identify and focus on farming practices that are low cost, low risk, and are evidenced to increase yield for small-scale farmers. We gather information from agricultural experts, our agronomist colleagues, and complementary literature, about the importance of key practices, expected yield increase, and information about complementarities across practices. To understand better what set of behavior changes and practices we can meaningfully influence, we use farmer data to estimate baseline adoption of targeted agricultural practices, farmers’ knowledge of these practices, perceptions of costs and actual costs.
For more complex farming practices, we collect more detailed data and insights to fill potential blind spots about farmer practices and perceptions, generate new, or different, hypotheses, and identify potential constraints to adoption. We also collect information to estimate the lead time farmers require to adopt new or amended practices. We ask farmers when they make their most relevant decisions and critical investments, and assess the extent to which changing behaviors would incur a time cost (e.g. travel time, procurement time, etc.).
Step 2: Improve Content Communication
When an advisory message is too long or too detailed, farmers may not have the time or bandwidth to process all the information. Delivering a compelling message helps to grab and maintain the attention of farmers, and helps to ensure that farmers connect with and internalize the information conveyed. Once we have identified priority content that can help farmers stabilize, or increase their production, we draft outbound messages using a message development template to increase the consistency and clarity of the framing. This template is one of the tools that help our team think about message design in a more structured way:
| # | Message Component | Maximum Length | Rubric | Notes |
|---|---|---|---|---|
| 1 | Welcome | sentence | Who is this message from? | Greeting and clearly identifying the sender of the call. E.g. “Namaskar, welcome to ‘Ama Krushi’, the Government of Odisha’s free agriculture information service.” |
| 2 | Topic | 1-2 sentences | What is this message about? | State advisory topic and briefly state concrete recommendation. E.g. “Today, we would like to tell you about an important practice called “seed treatment”, which means mixing your seeds with fungicide before planting. It is an essential precautionary measure to manage pests and diseases in crops. ” |
| 3 | Recommendation (Less technical) | 1-2 sentences | How should I act in response to this message? | A clear and if possible non-technical statement of the key recommendation. Ideally, there should be one recommendation per message. E.g. “In today’s advice, we recommend using either Carbendazim or Carboxin + Thiram to treat seeds before sowing. These seed treatment products are low-cost and widely available. ” |
| 4 | Rationale | Max. 3 sentences | Why should I change what I’m doing? | A brief explanation of the rationale behind the recommendation. E.g. “They protect crops from seed and soil-borne diseases and also help to produce healthy seedlings.” |
| 5 | Recommendation (More technical) | Max. 3 sentences | How should I act in response to this message? | A clear and more detailed technical statement of the key recommendation. E.g. “Seed treatment can be done in many ways, but here we will suggest two. You can use one or another. The first way is by mixing 2 grams of Carbendazim, also sold as Bavistin or Dhanustin, in every kilogram of seeds. The second way is by mixing 3 grams of Carboxin + Thiram, also sold as Vitavax power or Vaccinator power, in every kilogram of seeds.” |
| 8 | Thanks & followup | Max. 1 sentence | How to follow up for more information? | “Thank you, and remember that if you have questions about this advisory or need more information, you can call the Ama Krushi hotline on 155333” |
The template is intended to help us condense our main recommendations, emphasize their most essential components, and cohere message design.
If, for example, we find that farmers misperceive the efficacy or cost of a practice, we can emphasize the yield benefits and resource requirements in the recommendation rationale. When baseline knowledge and adoption are low, or the advice includes complex terms, we may determine that recommendations require additional reinforcement. In such cases, we can develop nudges and reminder messages focusing on critical aspects of the recommendation.
Lastly, the template helps us to document the evidence we use to generate our advice, thus improving the “evidence-based” nature of the content we develop. In addition to using the message template, we leverage behavioral insights and use framing tips and techniques to deliver the value proposition optimally. To ensure there are no discrepancies between the English and Odia versions of the message, another Odia-speaking member of the team will review translations and audio recordings before the dissemination of the message.
In the final section of this blog post, Srinivas VT, Research and Operations Associate, and Revati Vaidya, Process and Product Innovation Associate, provide an overview of our recently developed dashboard which allows for more effective and precise monitoring of program performance.
The objective of our dashboard is to provide a real-time view of program performance through Key Performance Indicators (KPIs) that:
- Minimize the need for longer data extraction processes;
- Allow us to quickly view the health of the program and identify issues via available trendlines; and
- Provide visual representation of data to put things in perspective.
Before we developed the dashboard, we needed to run long queries on pgAdmin to extract metrics. Now, we can select our parameters, press “compute”, and the dashboard pulls from the backend data tables which give us the metrics we need in an easy-to-read format. These dashboards have been developed using an R-shiny web application.
The Odisha dashboard is split into six operational sections. Data in each section can be filtered according to time and other parameters relevant to the section. For farmer data, for example, this includes demographic filtering (gender, district, smartphone ownership, etc.).
- Call Activity: Provides a quick view of the number of outbound calls that have gone out recently to farmers.
- Helpdesk: Contains the complete list of the questions that farmers have asked via the hotline. Recordings of the question/responses are embedded into the helpdesk tab so that we can listen to the recordings by pressing a play button.
- Profiles: Overview of Ama Krushi farmers, total registered, their demographic distribution, etc.
- Call Centre: Details on Call Centre productivity that include profiling rate, conversion rates, hourly productivity, etc.
- QnA Backchecks: A tab where the team can generate and listen to a random sample of Farmer Questions and Answers provided by the content team for quality checks (i.e to ensure proper tagging has been done, no valid calls have been rejected, etc.)
- Usage Data: This section is where ‘the meat’ of data on farmer engagement lies. This is, in turn, bucketed into three sub-sections:
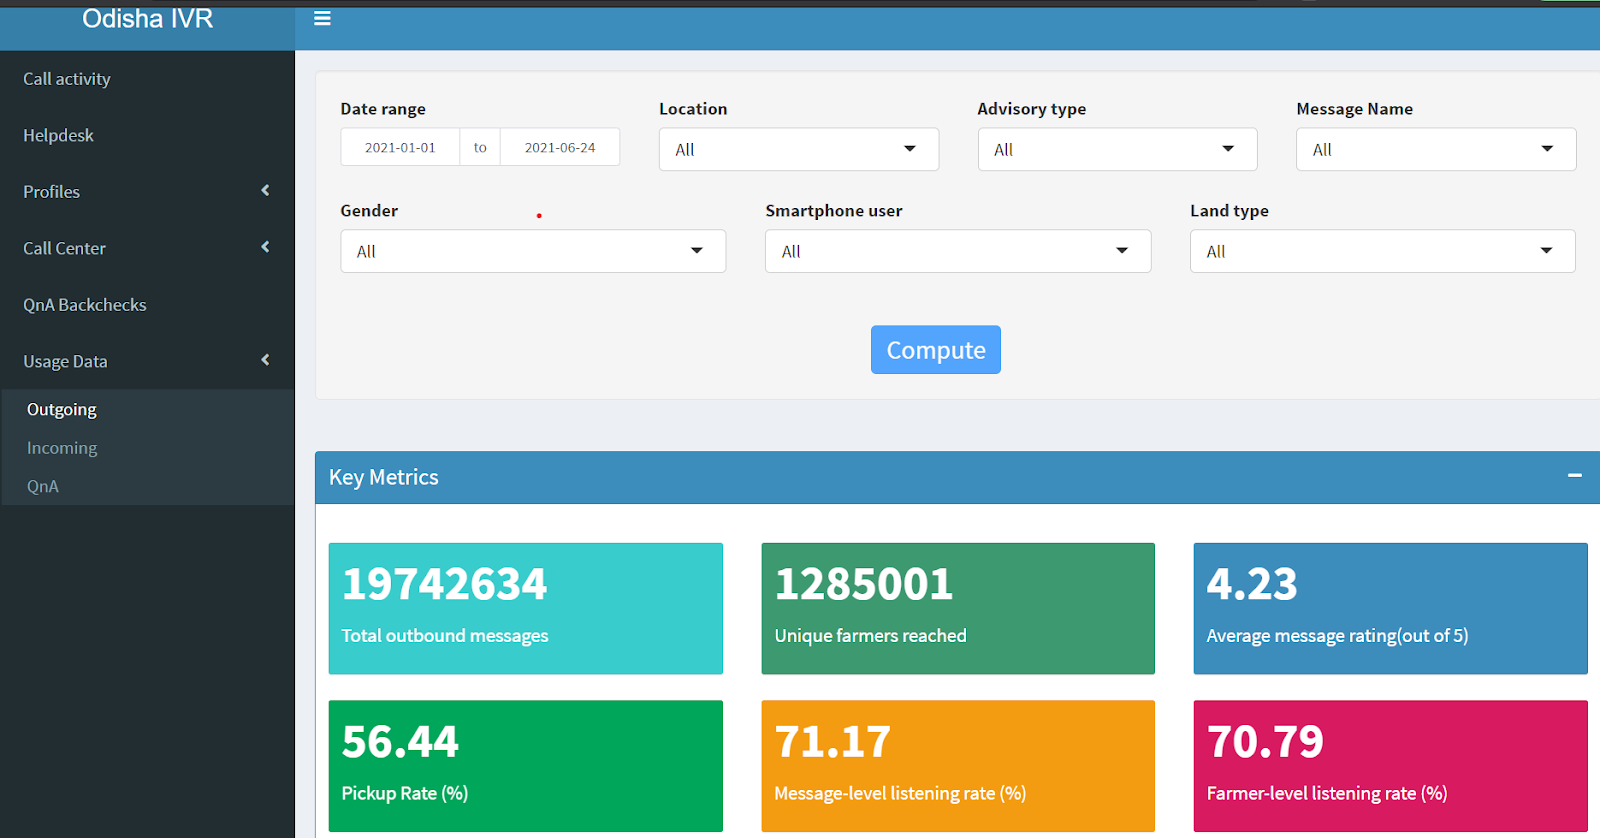
- Outgoing: This sub-section allows us to look at farmer engagement with our outbound calls – primarily how many farmers pick up our calls, how long they listen, etc. The screenshot below, depicts metrics for outgoing calls over the last six months:
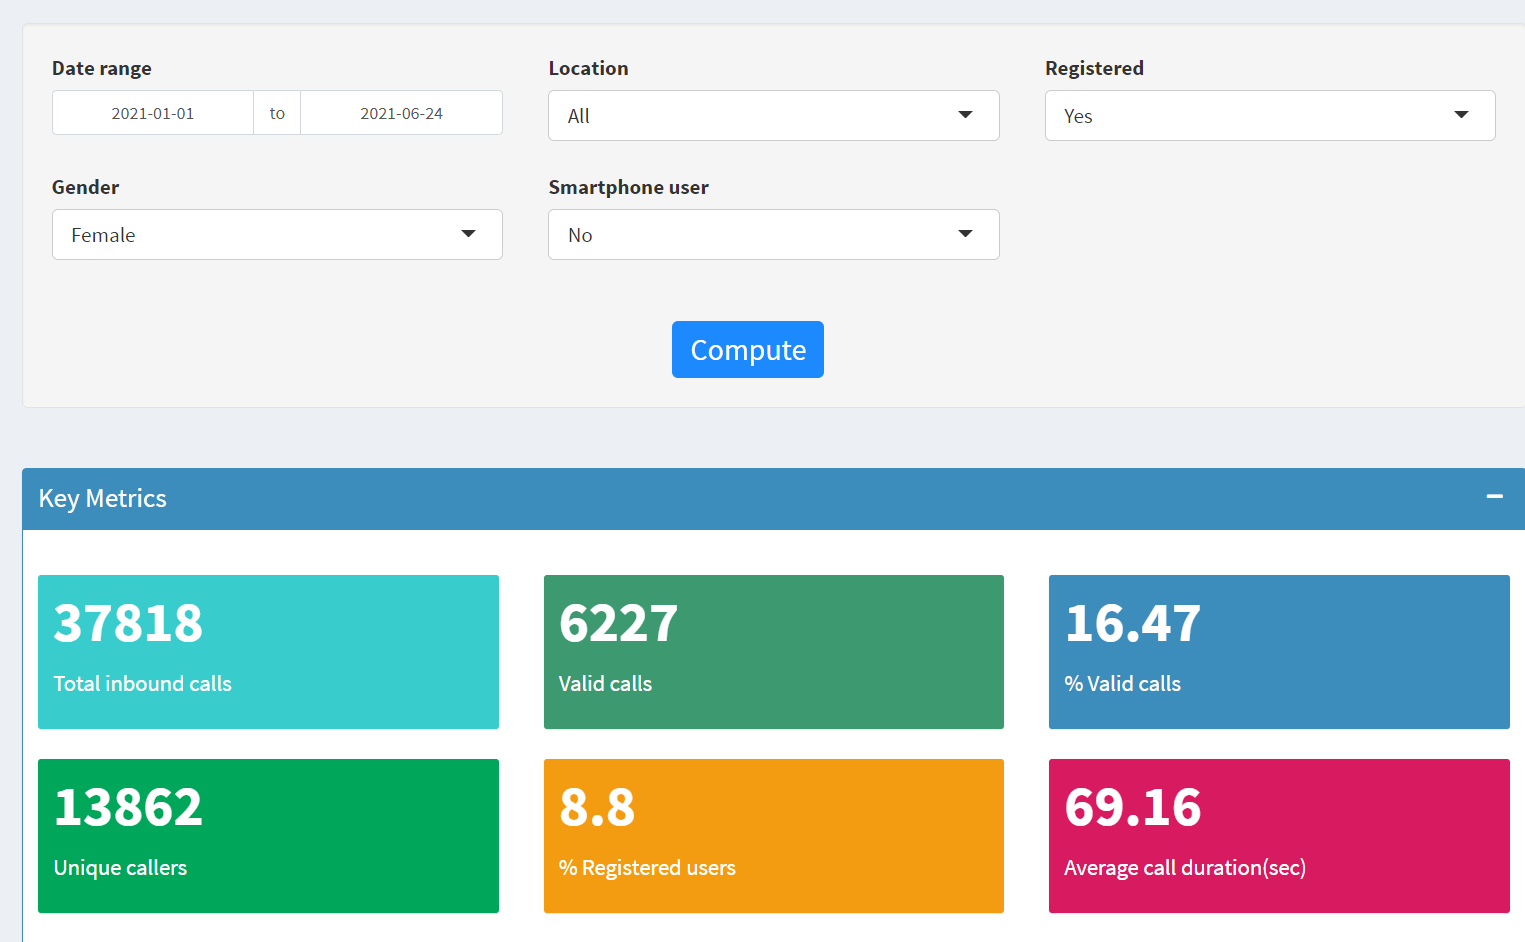
- Incoming: The sub-section provides us with details on (i) inbound engagement (how many farmers are calling in, how many of them are registered, how long they spend on the call, etc.) and (ii) what farmers do when they call in – i.e what part of the menu they go to. The screenshot below depicts inbound metrics for non-smartphone owning women farmers over the last six months:
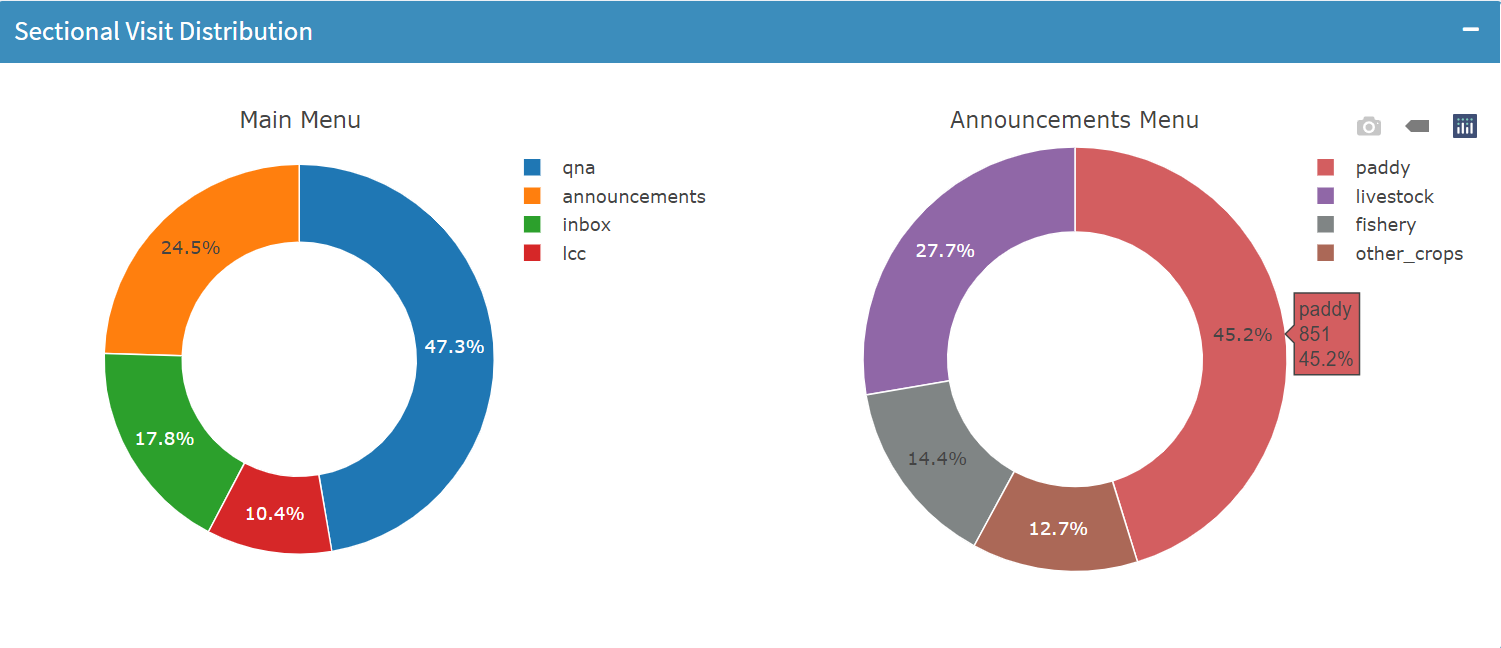
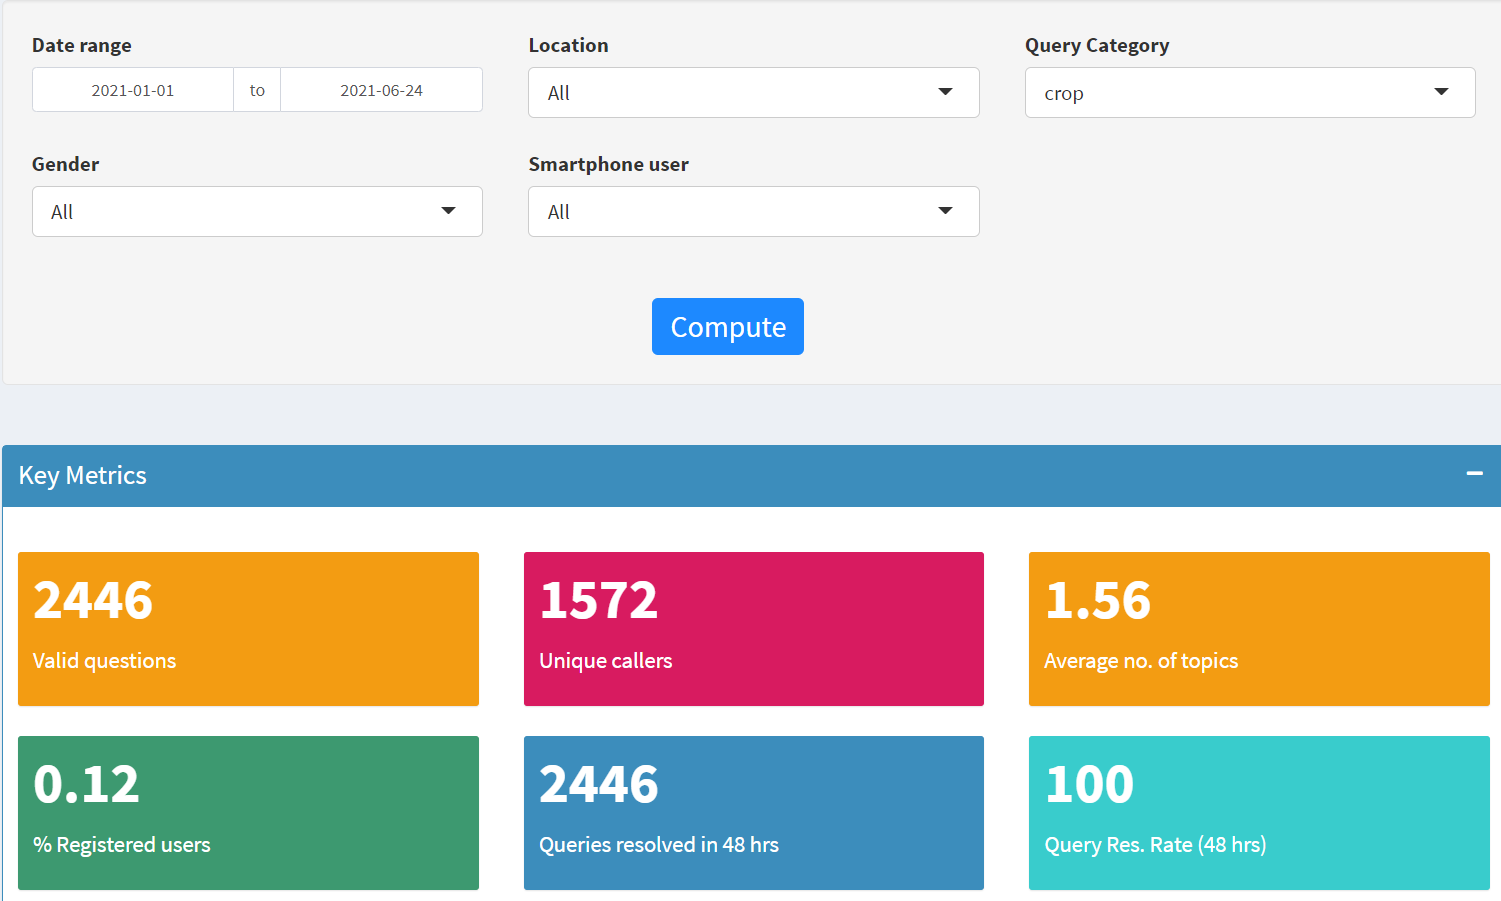
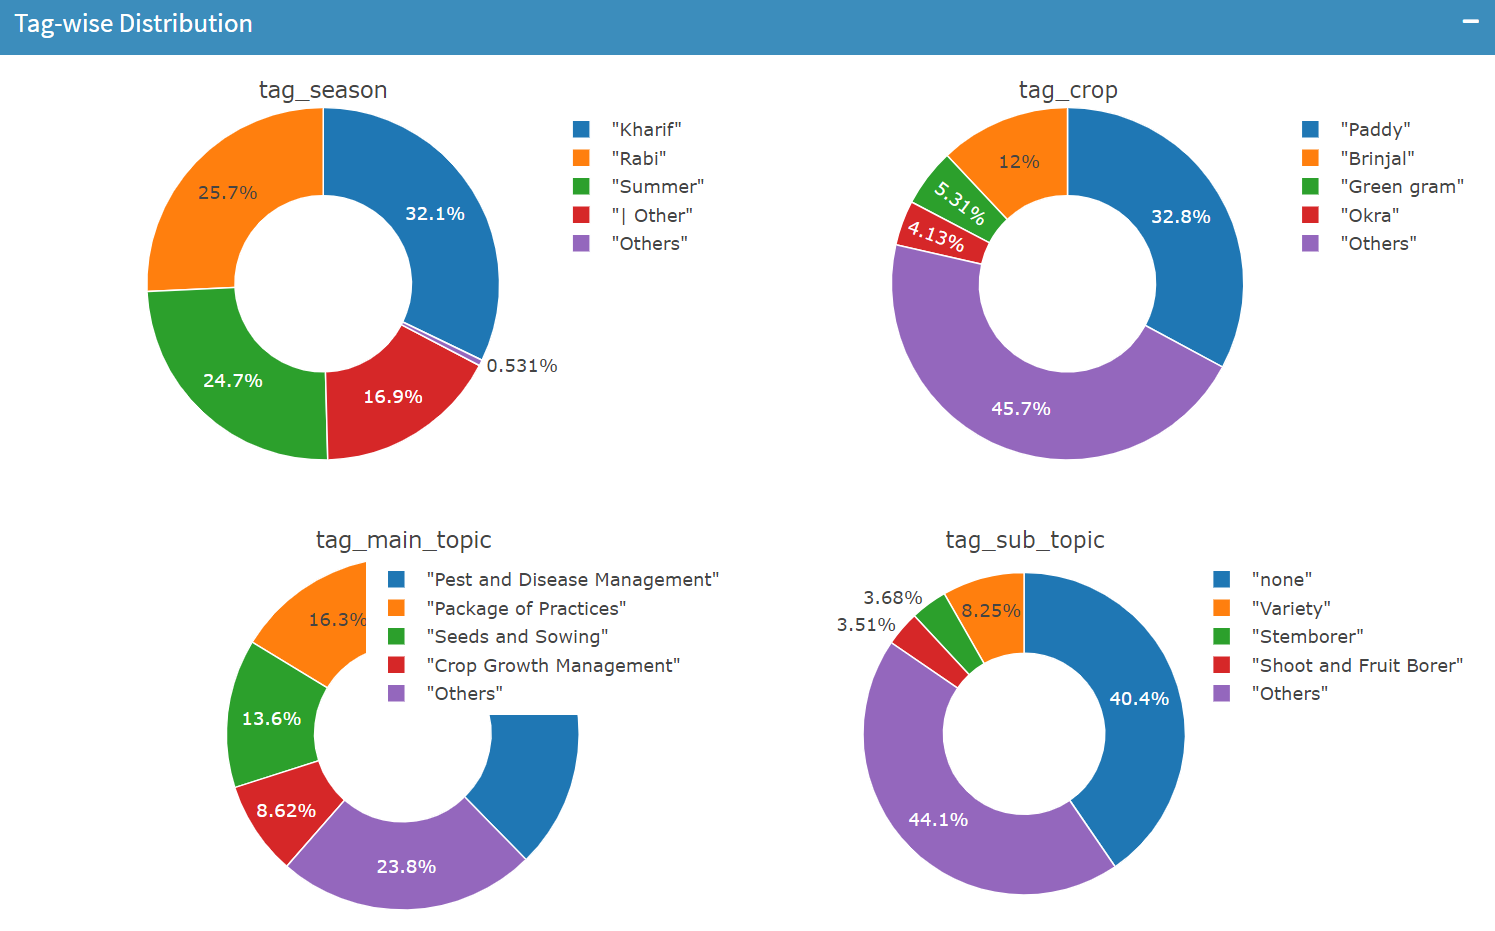
- Q&A: This sub-section specifically focuses on farmer questions allowing us to see:
- Key metrics looking at basic numbers (how many we are receiving, how many and how quickly we are responding to them); and
- Details on the types of questions (determined by how they are tagged).
The screenshot below presents data on farmers that have asked questions relating to crop-based advisory over the last six months:
All backend data has now been linked to our Odisha dashboard (a West Bengal dashboard is also up and running and undergoing further development!). As more teams begin using the dashboards regularly, we want to make sure that the experience is as seamless as possible. We plan additional UI/UX improvements in the coming weeks to optimize user experience and ensure the dashboard is doing what it is designed to do – giving us the data we need with ease, speed, and accuracy (and some fun aesthetic!). We eventually want to replicate the improved template across all project locations to create a centralized PxD`India dashboard.
As our teams and farmers navigate July’s unpredictable weather, the workstreams above are complemented by – and work in concert with – carefully calibrated and informed actions on the part of colleagues at our (remote) call centers, our government partners, and traditional extension agents. We hope that the synthesis of our activities and actions will support our farmers to make more informed and more productive decisions as they navigate a fruitful and bountiful Kharif season.
For more information about our work, or to explore potential partnerships, contact communications@precisionag.org